kyle conarro

I've been thinking a lot about tracing a work session's journey. There's valuable information within the journey itself, but it's typically lost in the sea of disparate apps.

I've been using tools to help me get into flow, but tracing isn't part of any of these (at least not yet). Plus, I often find it helps to start a flow session in order to map out the tasks (vs. mapping them all out before flow). Sometimes that's even required, as task discovery often lives inside of task execution.

Beyond discovered tasks, what other information is buried within the work process?

  • Trade-offs: As you work, you're making trade-offs. But they are often implicit in the final artifacts (e.g. subtasks or project updates). Ideally they
  • Edge cases: What boundaries have you stumbled into? Find anything you'd not yet considered?
  • Rabbit holes: Which paths are wrought with scope creep? Or aren't worth the effort?
  • Learnings: Did you learn anything new or interesting as you went?

Some of these thoughts may seep into your typical artifacts (e.g. code comments, task comments, etc.). But even then they're often implicit and unlabeled.

What if we could trace our path through a flow session, recording this information as we go?

This idea has been lodged in my brain for a while, so I think it's time to give it a try. Here's what I'm imagining:

  1. Start a work session, with some indication as to the starting point (e.g. a task or project name)
  2. Log stuff as you work. These logs get written somewhere and connected back to the original starting point.
  3. End the session. Any notes and logs are preserved and organized by session.

I've got a proof-of-concept rolling around in my head, stay tuned for more on what I rig up.

Before I start my workday, I like to jot down my top tasks and assign them a general duration (I use Centered to manage this). These tasks are often sourced from Notion, GitHub, or Todoist, but sometimes they also just fall out of my head based on the “cache” from prior work.

Once I lay out my priorities, I start a session (Pomodoro-style) and get into the first task.

The more atomic a task is, the more likely it will be self-contained. A small, simple task (e.g. pay the rent) can be started and finished without distraction.

But in many cases, even for seemingly atomic tasks, there are tangents and discoveries that shift your to-do list into non-linear space.

Something as innocuous as “check email inbox” can spawn dozens of follow-up tasks. We could certainly break this into more atomic tasks, but here's why I like doing this “in” the work instead of “above” the work:

  • Getting into a task gets you moving
  • Movement gives you momentum
  • For “deep work”, tasks are often only discovered by going on this journey

To define all tasks in advance would mean traversing the tree, identifying and documenting all the work, and then coming back “up” to lay out your task list.

Using the “check email inbox” example, let's say you end up with three email follow-ups. How do you know this? Ah yes, by checking your inbox! So the first “task” is to enter a work area and look around to see what needs doing.

Things I've been thinking about a lot lately:

  • How can we record this journey? Should we even care?
  • How can we minimize friction to logging findings along the way? The less disruptive to progress, the better!

Centered has served me moderately well (I can log tasks via keyboard shortcut while working on another task) but it's not great for “meatier” logs (e.g. jotting down a bug report uncovered while working on something unrelated). For that, I've found Reflect to be quick enough for now.

Would love to see more purpose-built tools around this (e.g. Flowpilot, but I also understand it's a pretty narrow audience. But hopefully a growing one!

When making decisions, it's easy to start by looking at the upside: what will I get by doing X? But considering the downside is just as important: If I do X, what am I giving up?

As a software engineer, I've seen my ability to think in these terms evolve. In the early days, I wasn't always aware of the trade-offs I was making. Hammering out a data model, for example, could corner me in ways that weren't yet clear to me. The trade-offs were implicit.

With experience (read: mistakes), I've gotten better at identifying these trade-offs. So even if a current decision is sub-optimal, clear trade-offs make it easier to design with resiliency.

When faced with a decision, take some time to identify the trade-offs and make them explicit.** Future you will thank you.

I recently purchased a Tern GSD (the S10 gen 2 model, for anyone interested) as a car replacement. I got the itch to ditch the car during the fall, as I noticed my car just sitting in the driveway for weeks on end. My wife and I actually shared a car for three years, but ended up with two again in 2019 as we had our second kid and needed the flexibility.

Fast-forward to 2021, we're in a new neighborhood where everything we need is within a couple mile radius. So I started researching bike options for toting kids 'n stuff, and after much deliberation (i.e. Reddit-ing, Youtube-ing) I landed on the Tern. It's been amazing ✨

https://s3.us-west-2.amazonaws.com/secure.notion-static.com/2269756e-65e9-426f-8cf5-8257ee1211a7/Untitled.png?X-Amz-Algorithm=AWS4-HMAC-SHA256&X-Amz-Content-Sha256=UNSIGNED-PAYLOAD&X-Amz-Credential=AKIAT73L2G45EIPT3X45%2F20220225%2Fus-west-2%2Fs3%2Faws4_request&X-Amz-Date=20220225T164243Z&X-Amz-Expires=86400&X-Amz-Signature=b7ed089e6c93e67efd28cf381516c84aca364f5d564e78a635819ec3d6942caf&X-Amz-SignedHeaders=host&response-content-disposition=filename%20%3D%22Untitled.png%22&x-id=GetObject

The Clubhouse Fort (source: ternbicycles.com)

I held out for the 2nd generation model to be able to use the Clubhouse Fort, a combination of accessories that gives me year-round, weather-proof child toting capabilities. This generation also comes with other goodies, like a better kickstand (for safely loading the little ones), a built-in Abus frame lock, and front suspension.

I've only had the bike for a couple of weeks, but I've been riding it daily. If you're in the market for a cargo bike, and especially if you're looking for a car replacement, I can't recommend the GSD enough.

Next up: time to sell the car 👋

Having officially “relaunched” this blog (i.e. I tweeted), I wanted to be able to see some basic analytics. Nothing fancy, just page views, top pages, referrers and the like, to get a sense of readership and how people find me.

I've come across a handful of good, privacy-focused, hosted options in the past year or so:

But I wanted to see what self-hosted options were out there (for potential cost savings, and also just developer curiosity). I found these:

They're pretty similar: clean, simple analytics tools that are easy to deploy and tracking code that “just works”. I opted for Umami, as it already supports event tracking (in case I ever care), has a bit better UI (in my opinion), and also uses Postgres (instead of Mongo) which I'm more familiar with.

I opted to host it on Heroku (since I already use it and am pretty familiar with it). There's documentation on deploying there, but I took this a step further and built a “Deploy with Heroku” button to automate the launch.

Got it running, added tracking code to Super.so, and voilà ✨

https://s3.us-west-2.amazonaws.com/secure.notion-static.com/7362933a-42a2-4e0c-a07a-dbf92439cc44/Untitled.png?X-Amz-Algorithm=AWS4-HMAC-SHA256&X-Amz-Content-Sha256=UNSIGNED-PAYLOAD&X-Amz-Credential=AKIAT73L2G45EIPT3X45%2F20220225%2Fus-west-2%2Fs3%2Faws4_request&X-Amz-Date=20220225T211645Z&X-Amz-Expires=86400&X-Amz-Signature=030ccdc3a0a7edcc3cc47ccb2ac8efc0fd9cf6de246e121949a62770a376d666&X-Amz-SignedHeaders=host&response-content-disposition=filename%20%3D%22Untitled.png%22&x-id=GetObject

It's been nearly three years since I did much (or really anything) on the blog, but I'm back! I've migrated the site from Github Pages to Notion + Super.so to reduce the friction of writing (we use Notion every day already). We'll see how it plays out... 👀

I'm also experimenting with ConvertKit to manage subscribers. I don't intend to build a massive personal brand, but I'm going to try to be a bit more organized and deliberate as I share my thoughts more often in 2021.

If you want to get new posts in your inbox, drop your email here 👇

https://conarro.ck.page/f3353d0aea

Note: This post was originally published on the Ad Reform blog.

We lean on a lot of great products to help us build our company. They provide a variety of functions for us, letting us stay focused on our core mission. We’ve already shared some of the services we use for sales, marketing, support, and communication. Now we’d like to share what we use on the engineering side.

If I have seen further, it is by standing on the shoulders of giants.

— Isaac Newton


Code / Continuous Integration

GitHub

Host and review code, manage projects, and build software alongside millions of other developers.

The most popular code versioning and management platform. Integrates with pretty much everything.

Price: $25 per month for a Team plan with up to 5 users

Semaphore CI

Test and deploy your code at the push of a button.

Polished and feature-rich continuous integration platform with a clean, easy to use UI. Automatically deploy when your builds pass, and notify Slack as well. They have great support, too!

Price: 30-day free trial, then $29 per month


Infrastructure

Amazon Web Services

Build sophisticated applications with increased flexibility, scalability and reliability

Don’t think I need to explain this one.

Price: Solid free tier, additional credits are available for startups through a variety of incubators/accelerators (e.g. ATDC)

Mandrill

Transactional email for Mailchimp

Transactional email API for sending app emails. Easy to use, and based in Atlanta!

Price: Free trial for 2,000 emails. After that, free with a paid Mailchimp account (starts at $10/mo.)


Logging

Bugsnag

Monitors your website and mobile app for errors impacting your customers.

Price: Free up to 7,500 events per month

Logentries

The fastest way to analyze your log data

Log management made easy. There are a handful of good logging services, but Logentries is very easy to integrate and has a generous free tier.

Price: Free up to 5 GB per month


Monitoring

Ghost Inspector

Easily build browser tests for your website or application. Monitor continously.

Quick and easy browser testing. Great for post-deploy smoke testing, or even full-fledged integration testing against staging or production environments.

Price: Free (up to 100 test runs per month)

Scout

Track down memory leaks, N+1s, slow code and more.

Get detailed traces of slow requests and link directly to the line(s) of code causing the slowness. Lots of cool features: email digests, auditing in dev environments, and more. Also, great support!

Price: starts at $99 per month

Speedtracker

Runs on top of WebPageTest and makes periodic performance tests on your website and shows a visualization of how the various performance metrics evolve over time.

A nice (and free) way to visualize your site’s performance over time. Very easy to set up, too!

Price: Free (as in 🍻 and as in speech)

Uptime Robot

Monitors your websites every 5 minutes and alerts you if your sites are down.

No-frills uptime monitoring that pings sites and sends alerts. They have a solid free tier, which is great for smaller companies who just need the basics.

Price: Free (up to 50 monitors running every 5 minutes)


Other

Headway

Changelog as a service. Simple as that.

Makes it easy to share new features, bug fixes, and improvements with your customers directly within your app. Lots of nice features (e.g. Twitter and Slack integration), and a transparent roadmap suggests plenty more to come.

Price: Free


Whew! That’s quite a list. We’re big fans of staying focused, and thanks to these services we’re able to do just that as we build out our technology. Have questions about how we use any of these? Or just want to connect? Let me know on Twitter!

Ad Reform builds simple tools to improve the digital advertising experience and the process for the delivery of ads

This post was originally published on the Rigor Web Performance blog.

UPDATE: The Semaphore/Zoompf Sinatra app referenced in this post is available on Github here. We’ve also updated the comparison to use total defect count (instead of Zoompf score) to catch all regressions before they hit production. Here is what the new Slack notifications look like:

https://rigor.com/wp-content/uploads/2016/02/semaphore-zoompf-slack.jpg

As a performance company, we’re always looking for ways to incorporate performance into our development process. With the recent release of version 2 of Zoompf’s API, we’ve been exploring methods of automating some of the manual performance analysis we do as a team. While playing with the new API endpoints, it occurred to us: when we push new code, we automatically run tests to catch functional regressions. Why can’t we do the same to catch performance regressions?

When we push new code, we automatically run tests to catch functional regressions. Why can’t we do the same to catch performance regressions?

Spoiler alert: we can (and did)

To continuously analyze performance, we need two things:

  1. A tool to analyze performance (Zoompf, our performance analysis product)

  2. A way to notify said tool of code changes

We use Semaphore CI, a hosted continuous integration service, to build and deploy our application. Semaphore’s platform has a handful of integrations to enable notifications of builds and deployments. For our use case, Semaphore’s post-deploy webhooks are the answer. Post-deploy webhooks allow us to notify an arbitrary endpoint when an application is deployed, giving us the second item required for continuous performance analysis.

Connecting the Dots

With the two ingredients in hand, all we need is a web service to receive webhooks from Semaphore and trigger performance snapshots via Zoompf’s API.

To accomplish this, we built a simple Sinatra-based web service that:

  1. Receives webhook notifications from Semaphore on each staging deployment

  2. Triggers a snapshot for one of our Zoompf tests (in this case, a test against our staging app)

  3. Posts a link to the latest snapshot in Slack

With this in place, we now had automatic snapshots for each staging deployment, giving us a good idea of how each shipment impacted our performance. But receiving a Slack notification of a new snapshot isn’t all that helpful. In order to see what changed, we had to click the link and manually inspect our performance test results. Not only that, we were getting a lot of noise in our Slack channel, as our staging environment gets deployed several times a day.

Detecting Regressions

To avoid manual inspection and cut down on noisy notifications, we decided to automate the regression detection. Using Zoompf’s snapshots API, we can retrieve all snapshots for a given test. To detect changes, all we need to do is compare the latest snapshot to the previous snapshot.

The API has a couple of handy parameters to make this easy: p_per_page and p_order_by. These parameters allow you to specify the number of snapshots you want to see and sort by a given attribute, respectively. For our use case, we only need the two most recent snapshots, so we can set p.per_page=2 and p.order_by=ScanAddedUTC. Here is an example of what that request looks like:

curl "<https://api.zoompf.com/v2/tests/:test_id/snapshots?p.per_page=2&amp;p.order_by=ScanAddedUTC>"

Armed with the two latest snapshots, comparing them is easy. In our case, we compare the Zoompf scores of each snapshot to measure the change. However, automating this comparison within our web service required us to make some changes. Instead of simply triggering a new snapshot, we now have to:

  1. Trigger a snapshot

  2. Wait until the snapshot is complete (i.e. poll the snapshot’s status)

  3. Get the latest two snapshots and compare their Zoompf scores

The first version of our web service triggered the snapshot to Zoompf within the request/response cycle. This was a quick solution for our original needs, but it wasn’t ideal. Adding the logic required for automated regression detection would have introduced a fair amount of overhead that would bog down the web server. To avoid this problem, we added Sidekiq, a Redis-backed asynchronous worker framework written in Ruby, to our application. Moving the core logic into asynchronous workers shifted the bulk of the work out of the request/response cycle, keeping our web server fast and responsive.

With the Sidekiq changes added, our web service now:

  1. Receives webhook notifications from Semaphore on each staging deployment

  2. Enqueues a Sidekiq worker

  3. Returns a 202 “Accepted” response

And our Sidekiq worker:

  1. Triggers a performance snapshot

  2. Waits until the snapshot is complete

  3. Gets the latest two snapshots and compares their Zoompf scores

  4. Posts in Slack if performance has regressed (or improved)

The regression detection update yields much more useful Slack notifications. If a staging deployment causes a performance regression (or improvement), we’ll get notified immediately via Slack. This notification links to the comparison of the last two snapshots in Zoompf, giving us one-click access to the performance changes. We can also click on the “Commit” link to see what code change was deployed by Semaphore, reducing the steps necessary for tracking down the root cause of any regressions.

Furthermore, the new workflow reduces the number Slack notifications by suppressing snapshots that did not impact performance. As anyone who’s ever been on call knows, figuring out what notifications not to send is important for avoiding alert fatigue.

Conclusion

How should a continuous performance analysis tool work? We identified the following useful features: * Automated performance analysis on every successful deployment * Detection of regressions (and improvements) in the latest version of the application * Integration with notification tools (Slack, in our case)

Automating the performance analysis process has helped our team by: * Reducing time spent manually inspecting performance * Improving code coverage from a performance standpoint (i.e. it guarantees that all changes trigger a performance analysis)

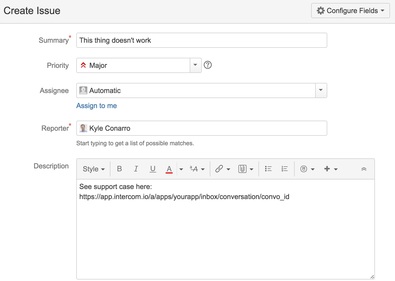
At Rigor we use JIRA to track our development tasks and Intercom to handle customer support. When a support case comes in that requires development work, we create an issue in JIRA. To connect the systems, we add a private note to any related Intercom support cases with a link to the issue in JIRA.

As we’ve grown, it’s gotten more difficult to keep these two systems in sync. To automate some of the manual effort, I built a Sinatra-based web service to connect JIRA and Intercom.

How it works

  1. Deploy the web service to your favorite platform (we use Heroku)

https://www.herokucdn.com/deploy/button.svg

  1. Add the web service as a webhook in JIRA and register the “issue created” and “issue updated” events

https://silvrback.s3.amazonaws.com/uploads/93f8ad1d-4e57-42b0-ba6c-39095558a776/WebHooks_-_JIRA_medium.jpg

  1. Include a link to an Intercom conversation in your JIRA issue descriptions

https://silvrback.s3.amazonaws.com/uploads/b96cfcc3-e6bb-4405-9894-43be1115b568/jira-intercom_medium.jpg

  1. A private note will be posted to the Intercom conversation with a link to the JIRA ticket created in step 2

https://silvrback.s3.amazonaws.com/uploads/17ccdf49-6071-437b-bd26-4f6979401687/intercom-jira-note_medium.jpg

For more on setup and configuration, see [the project’s README](https://github.com/kconarro14/jiraintercomwebhook/blob/master/README.md).

What’s next

Currently the web service handles the jira:issue_created and jira:issue_updated webhook events and looks for Intercom URLs in the issue description. Future enhancements might include:

  • Listening for new or updated comments that include Intercom links
  • Adding support for post-functions to add Intercom notes when a linked JIRA issue’s status changes
  • Tagging Intercom conversations with the issue ID to simplify finding all conversations related to a specific JIRA issue (Intercom doesn’t support adding tags via API as of yet)

I’ll post blog updates as any major features are added, but be sure to check out the project on Github for updates.

This post was originally published on the Rigor Web Performance blog. It is based on a talk I gave at the Atlanta Web Performance Meetup. Here are the slides from that talk.

Modern websites make a lot of requests. And I mean a lot. And many of these requests are to third-party resources. As this trend continues, it is important to routinely analyze the performance cost of your site’s resources to identify areas for optimization.

One approach to such an analysis would be to aggregate requests at the domain-level. Using raw HAR data, the data that underlies the popular waterfall chart, we can calculate the performance cost of each domain that our site uses.

Using this HAR as an example, our domain analysis for the five slowest domains would look like this:

http://rigor.com/wp-content/uploads/2014/11/screenshot-2014-11-26-at-1.38.31-PM-e1417027172979.png

CNN Domain Analysis

This approach makes it obvious which domains contribute the most to our overall load time. But now what? One option is to eliminate requests to a given domain to reduce its cost. For example, let’s remove all requests to z.cdn.turner.com. A quick scan of the page source reveals nine references to this domain:

https://docs.google.com/a/rigor.com/uc?id=0B4OqDVTQ1tMPQ1d3WmFYZHRNT3c

CNN Page Source

Removing all nine of these should do the trick, right? Unfortunately, no. Looking back at our domain analysis, there are actually 30 requests being made to this domain. So where are the other 11 requests coming from?

Tracking down requests with HTTP Referer

To find the 11 other requests, we can use the HTTP Referer request header to reevaluate our HAR data. This header identifies the resource responsible for making a given request. Here is what the referer analysis looks like for our example HAR:

https://docs.google.com/a/rigor.com/uc?id=0B4OqDVTQ1tMPTU5GVUFMcFE2LTg

CNN Referer Analysis

Instead of aggregating requests by domain, we can now see the resources responsible for the majority of the site’s requests. Not surprisingly, the base page (cnn.com, in this case) is often the main referer. But scanning the table reveals other expensive components, one of which is a resource loaded from z.cdn.turner.com. Expanding this referer reveals several requests to z.cdn.turner.com that we weren’t able to find in the page source:

https://docs.google.com/a/rigor.com/uc?id=0B4OqDVTQ1tMPN2R2TjZNSWcwQnc

Second referer

To make this new analysis even more powerful, we can search for all resources referering to or from z.cdn.turner.com. Any resource matching the search is either requesting additional resources from that domain or is hosted on that domain. Here is what our search results would look like using our same example HAR:

https://docs.google.com/a/rigor.com/uc?id=0B4OqDVTQ1tMPVHVBN0JjX2cxWms

Referer search

Using the power of HTTP Referer, we can now assign costs to each component we add to our site by seeing how many requests it makes. Instead of treating a new JavaScript library as a single resource, for example, we can now include all the dependent resources it requests in our cost analysis, giving us more insight into the cost of a given file.

To simplify this type of analysis, we’ve created a simple tool at insights.rigor.com. Simply upload a HAR file, and the tool will generate domain and referer reports to help you identify costly components. Next time you are adding resources to your website, consider using HTTP Referer to combat bloat and slow load times.

Enter your email to subscribe to updates.